Where I give new ideas time to grow
Nikos Katsikanis - 7 September 2026
I have added an Experiments page to my site. It is where I develop small ideas and test them in public before deciding whether they deserve a website of their own.
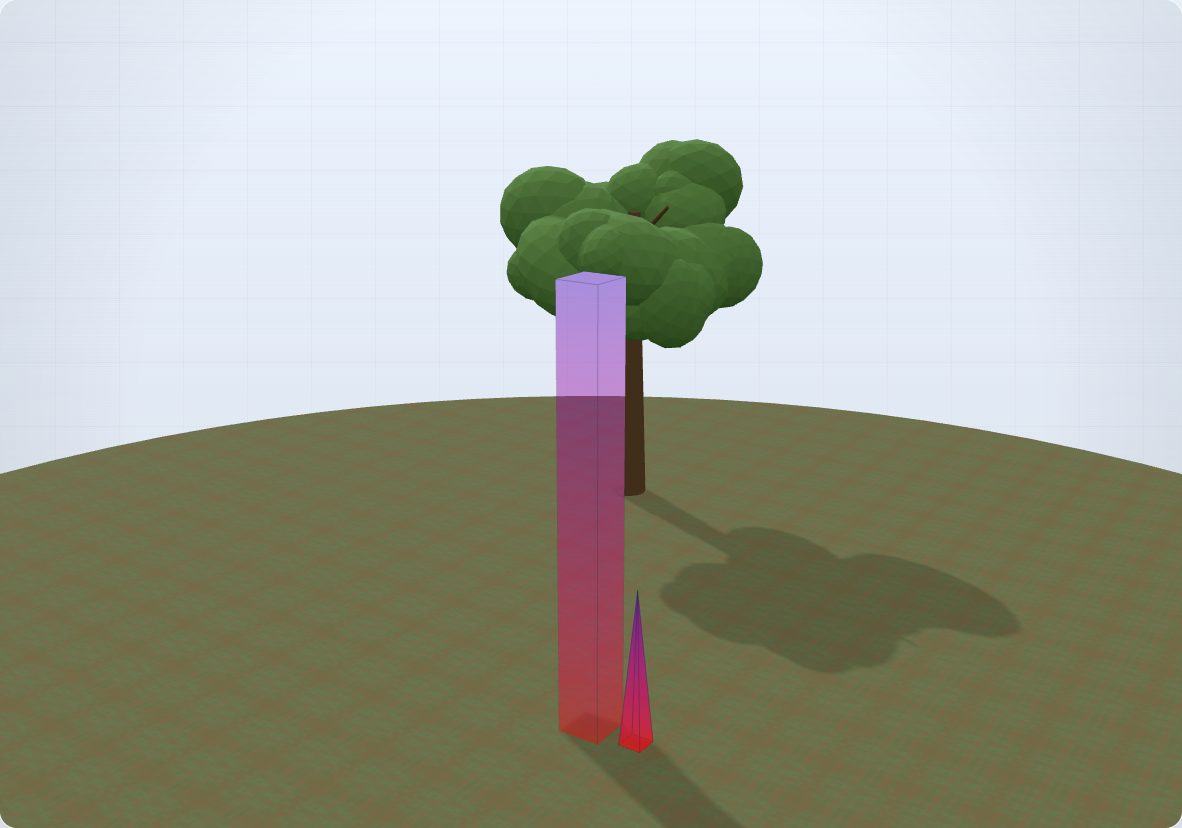
I give each idea a place to start
I do not know at the start whether an idea needs to become a separate product. I need to build enough of it to find out.
My Experiments page is a place for that early work. The projects are still growing. I can change their direction, remove parts that do not help, or stop working on them if the idea does not hold up.
I will give a project its own site when it has a clear purpose, works reliably, and gives people a reason to return. A new domain can wait. I want evidence that the idea is worth developing first.
I want to find out how far I can take the browser
I want to build things people can open with a link and use straight away. I am interested in how much I can calculate and show in a page that opens from a link.
I also use the latest artificial intelligence (AI) models to help me write, review, and test the software. These experiments give me a way to judge that help against something that actually runs.
I still have to decide what the software should do and check that it does it. Generating more code is easy to count. I care more about whether the result works and makes sense.
I started with WebJenga
I built WebJenga to explore a simple model of a concrete pillar. I can change its size or put more weight on top. I can turn the view around, change a number, and see the result.
I use the word stress for force divided by the area carrying it. Imagine the leg of a heavy table. It has to carry the weight above it. A wider leg spreads that force across a larger area. WebJenga lets me explore that idea with a simple concrete shape.
I have added three guided experiments. In each one, I start from the same pillar and change just one thing:
- I double its height. There is twice as much concrete above the base, so the stress caused by the pillar's own weight doubles. The contribution from the load on top stays the same.
- I double its width. The same top load is spread over twice the area, so its contribution to stress halves. The contribution from the pillar's own weight stays the same: there is more concrete, but also more area to carry it.
- I double the load on top. That contribution doubles. The pillar's own weight has not changed.
I show the starting and current numbers next to each other. I find the width experiment particularly useful because a wider pillar is heavier, yet the stress from its own weight does not increase in this model.
I use colour to help show the pattern, but the colour scale adjusts as the model changes. I compare the numbers when I want to know how much has changed.
I have kept the model small enough to explain. It does not predict cracking, bending, or collapse. I use it for learning, not for deciding whether a real structure is safe.
For developers: how I built it
I keep the calculations in C++, a programming language often used for work where control over performance matters. I compile that code into WebAssembly, a format the browser can run. The calculations happen on the visitor's device.
I use JavaScript to connect the controls to the calculation, and Three.js, a JavaScript library, to draw the three-dimensional view. Changing an input causes the app to calculate new values and update the picture.
I can express the core calculation at the bottom of the pillar in a few lines. Here is the same calculation in JavaScript, with the units written out:
const widthMetres = 1;
const depthMetres = 1;
const heightMetres = 5;
const densityKgPerCubicMetre = 2400;
const topLoadNewtons = 100000;
const gravity = 9.80665;

const area = widthMetres * depthMetres;
const stressFromTopLoad = topLoadNewtons / area;
const stressFromOwnWeight = densityKgPerCubicMetre * gravity * heightMetres;
const baseStressPascals = stressFromTopLoad + stressFromOwnWeight;

console.log(baseStressPascals / 1000); // 217.6798 kilopascals
I use newtons to measure force and pascals to measure force per square metre. A kilopascal is 1,000 pascals. With these starting values, the top load contributes 100 kilopascals and the pillar's own weight contributes about 117.68 kilopascals.
I check the calculation with automated tests. I also test the page in a browser, because correct arithmetic does not guarantee a working app.
During work on these experiments, an AI review found that clicking the buttons quickly could skip the starting measurement. I changed the controls to wait until the calculation finished. It was a small fault, but it broke the comparison the experiment was meant to teach.
I use smaller, cheaper models for simple, separate jobs and keep the overall decisions and final checks together. I described more of my approach to writing software in Writing More Code Myself With AI.
I will let the experiments earn their next step
For now, I want WebJenga to explain a few ideas well. I will use what I learn from building it and watching people use it to decide what belongs next.
I have put the current version on the Experiments page so people can try it while I work out the next step.